Price Gaps
Pattern example number five is Gaps. There are three different types of gaps: Breakaway, Measured, and Exhaustion. Breakaway mark the beginning of a move, Measured the center of a move and Exhaustion the end of a move. These patterns offer powerful insight into the psychology of the current market.
While trading gaps you will want to look at the personality of the chart. Avoid charts that have gaps all over. These types of charts greatly reduce the significance of the gap pattern. Look for charts that have a gap here and there. This will indicate true changes in supply and demand relative to the chart. We are going to look at each of these in turn starting with a Breakaway Gap example.
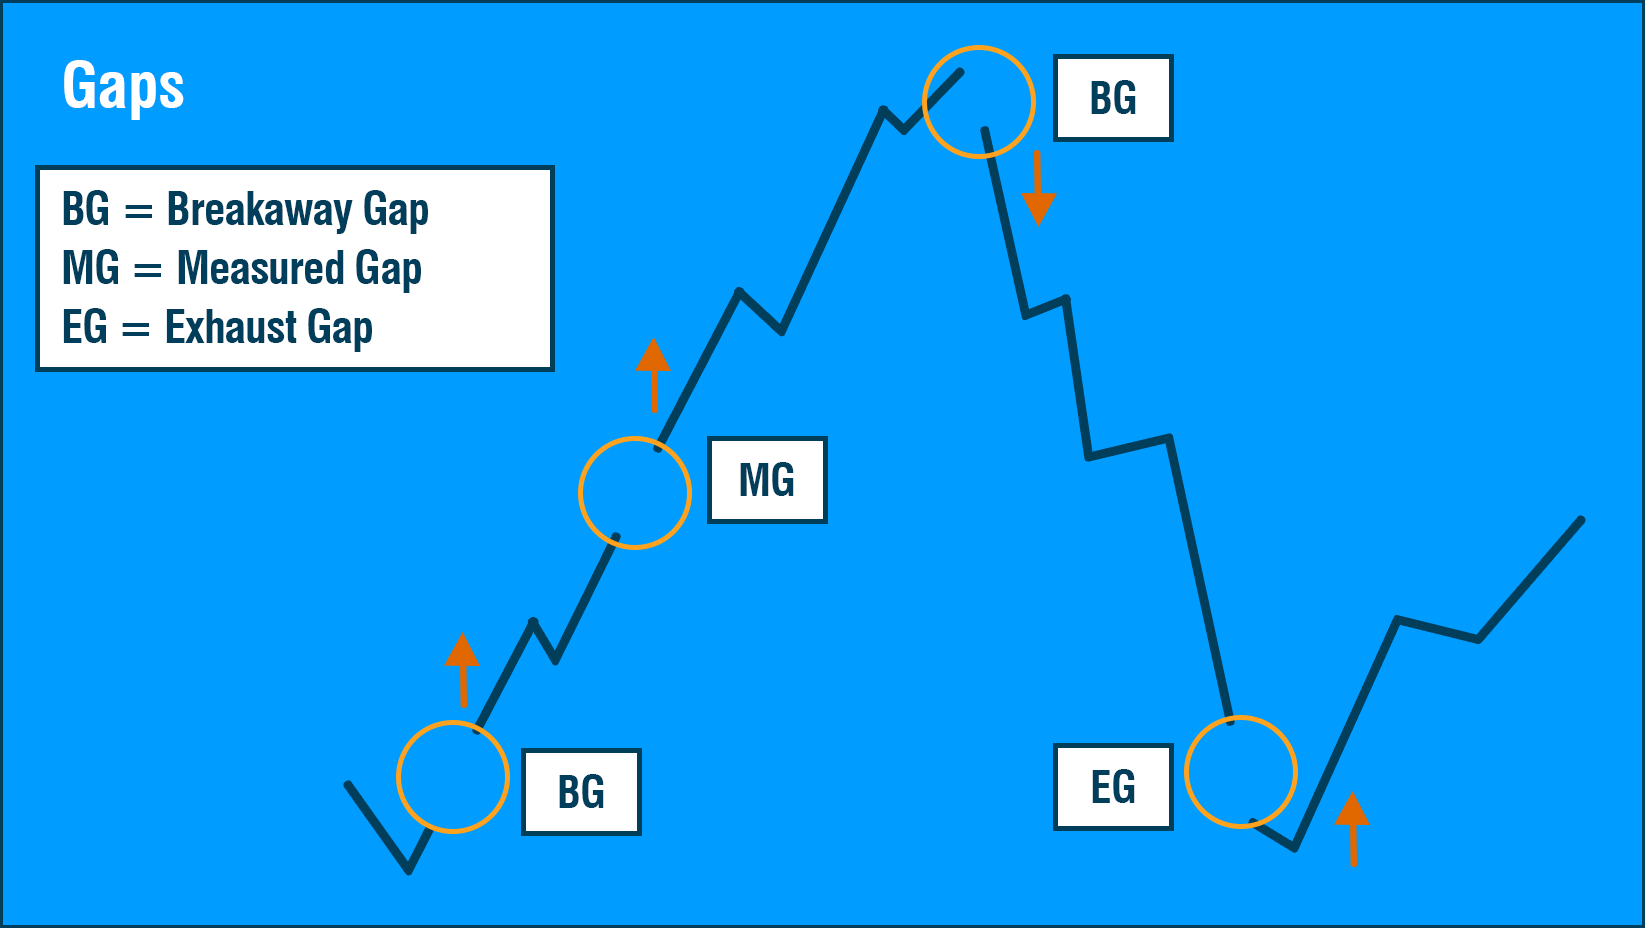
Price Gap Structures: Break Away, Measured, & Exhaustion
With a Breakaway Gap, you want to look for a gap off a support or resistance level. As soon as you detect a gap, give it a bar or two after the gap for confirmation that the chart is actually moving from that point. The problem with gaps is that you really cannot calculate a good target easily. One idea would be to use the prior resistance level, in the case of a Breakaway Gap going to the upside. But it is difficult to validate good targets. You want to use your Eighths scale to manage the trade and follow through the change in supply or demand to the upside or downside.
I cannot stress enough that there is nothing magic about a gap or support level or anything else. What you are looking at is how the market is reacting to the picture. That is what is key. You want only to trade the very obvious gaps.
Price Gap Structures: Break Away, Measured, & Exhaustion
In the following example of Anthem Inc., go back through the end of January and just follow those bars as it went along. You can see that the distance from one bar to the next is very consistent. There is one small gap there at the early in February, but generally, those bars are right next to each other until you get to February 16th.
We have almost a dollar gap from the 12th to the 16th this tells you that the chart is probably going up. The Breakaway Gap is labeled a Breakaway Gap because it occurs fairly close to the low point at $117.
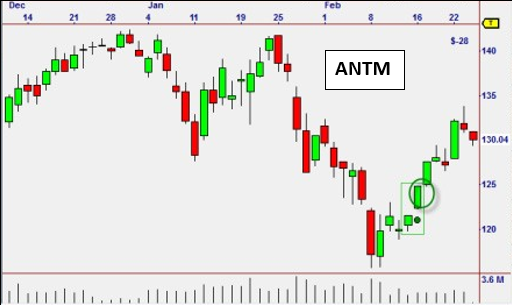
Anthem Inc. (ANTM)
Breakaway Gap: Teradata
Here is a very good example of a Breakaway Gap that occurred on Teradata. Note that the size of the gap is very large compared to other places in the chart.
If we go back to the left of the chart, there are two fairly large gaps that are not marked. The first one occurs at the end of February where we have prices moving in a trading range. It suddenly takes off with a Breakaway Gap to the downside. Then we have another gap a little bit later around May.
Move forward to August where we have the gap marked and you can see that it is a true gap with an actual distance across to the next bar. That is your Breakaway Gap. Using the Eighths tool and we could stay in the trade all the way to November and get out at about $28. That was 13% profit on that trade. This illustrates how well the Eighths tool works in managing trades.
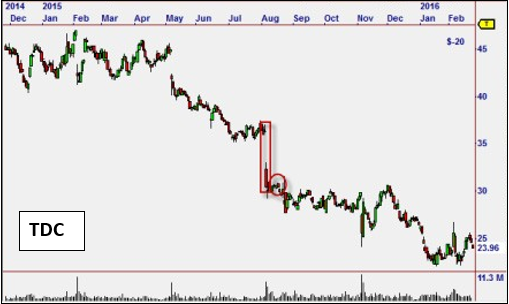
TeraData (TCD)
Price Gap Examples
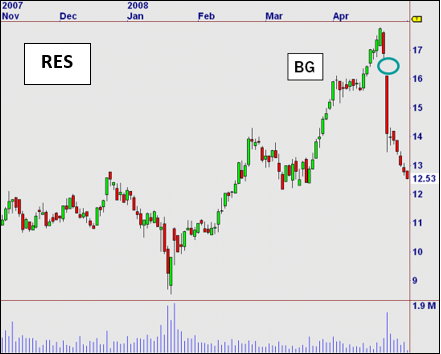
RPC Inc. (RES)
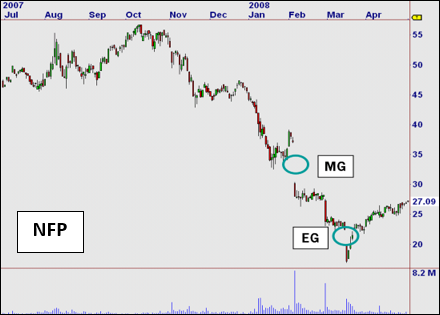
National Financial (NFP)
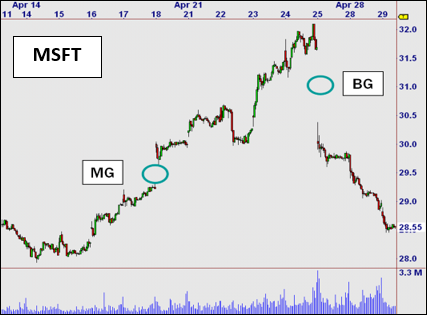
Microsoft (MSFT)
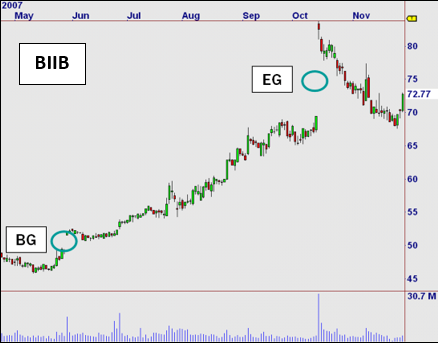
Biogen Idec Inc. (BIIB)
WHAT IS FULGENT.AI?
The team at Fulgent has been applying Artificial Intelligence to the market with great success over the past 20 years. Using specific market measurements, security chart measurement, multiple time frame analysis and cross market correlation, Fulgent AI continually finds the best possible "setups" with unmatched accuracy and profitability - guaranteed to give you an edge, or your money back.

Call Us: 800-880-0338 Email Us: sales@fulgent.ai Fax Us: 512-345-4225
Following over 20 years of experience with A.I. the staff at Fulgent is now focused on ADAPTIVE Machine Learning, where computers learn to trade the markets in the same way human traders do.

Call Us: 800-880-0338
Email Us: sales@fulgent.ai
Fax Us: 512-345-4225
Following over 20 years of experience with A.I. the staff at Fulgent is now focused on ADAPTIVE Machine Learning, where computers learn to trade the markets in the same way human traders do.

