Consolidations
The last pattern is my favorite and it is the most powerful pattern. Essentially, a Consolidation is a trading range. In a chart, it is a zone between Support and Resistance. It can be sloped Support and Resistance. But, in all cases, you have price moving back and forth between those two support and resistance lines until finally, one of the lines is broken decisively. Consolidations can be symmetrical triangles, pennant patterns, flag patterns, rectangles. Any tight trading range is a Consolidation.
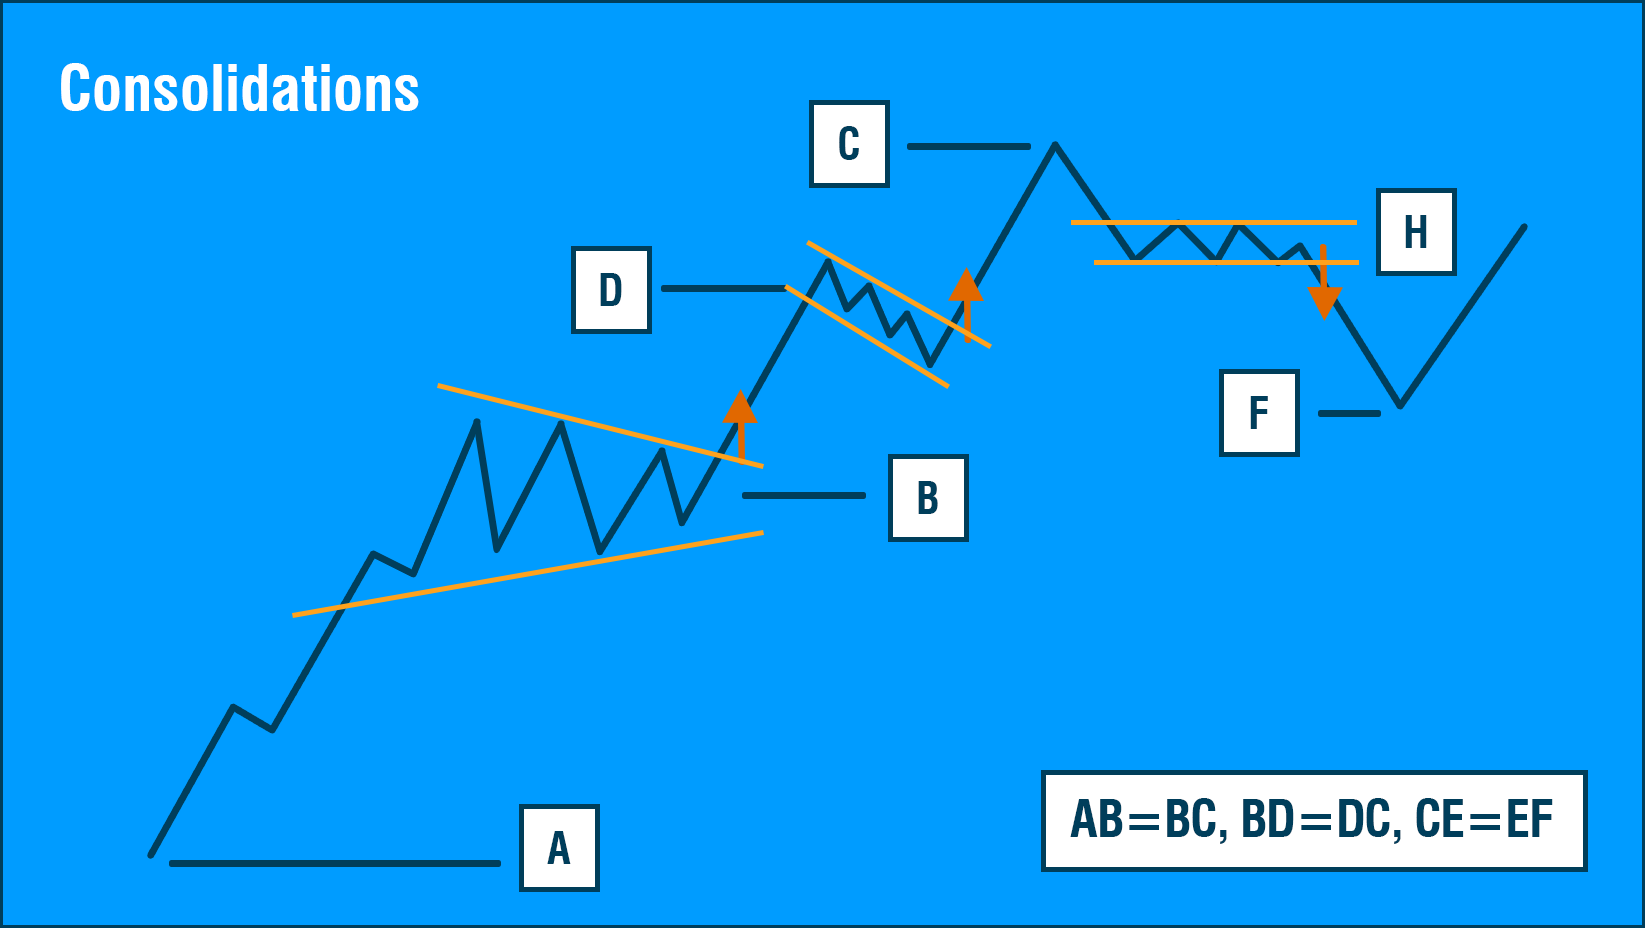
Consolidation Structure
The following diagram illustrates the structure of the ideal Consolidation. There are several things to note about it. First, lets go to the very left of this illustration, where you have a low point. Consolidations always form from a prior move.
You cannot just have a trading range in the middle of a chart somewhere and call it a Consolidation. You have to look to the left of the chart and see if you have a prior move from which the Consolidation came. In this example, we formed a low point, we rallied, formed the Consolidation, and finally broke out to the upside where it is labeled Long entry.
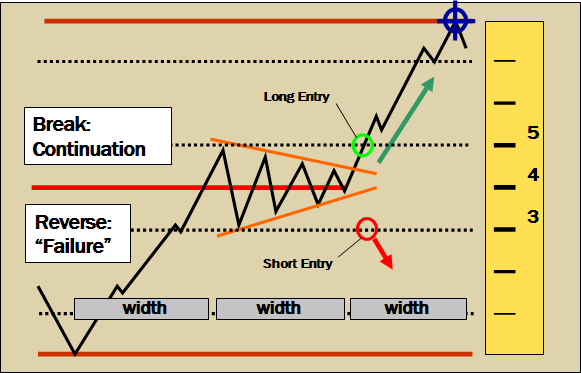
Consolidation Structure Diagram
Here is the reason Consolidations are so powerful. Measure the width of that range. What you will find is, if you go to the left of the chart the same width, moving the exact same distance to the left, you will almost always find a low point that same distance away. Now, take the width again and move to the right to find out where the target is. You will also find that Consolidation occurs in the center of the ultimate move. You can also go up twice the distance from that relative low that we found on the left to the center of the Consolidation to get the vertical distance to the target.
Those two dimensions very accurately pinpoint where the chart is most likely going to go from that formation of Consolidation.
In the following examples, I think you will see that this really does work and is an amazing, powerful, and trade-able pattern. If a Consolidation fails and goes in the opposite direction, that pattern is equally trade-able. The psychology of the market has suddenly shifted in the wrong direction and something is wrong with the chart. It should be shorted in this example.
Consolidation: Metlife.
In this first example of a Consolidation, you can see that we had a trading range form around the price of $48. Price moved back about three or four times before breaking through at $47.
The width of that Consolidation is approximately midway between the high and low from December. You draw your Eighths scale starting with the low point, but instead of moving relative to a prior move in the chart, we move through the Consolidation so that the Eighths scale is actually centered on the Consolidation with the 4/8 line through the middle of the Consolidation. We once again use our Eights scale extension and you can see our exit would have been near $43 for a 7.5% gain.

MetLife (MET)
Consolidation: Sherwin-Williams
This example shows a very well-formed Flag Continuation Consolidation on Sherwin- Williams (SHW). To find the anchor for this Consolidation, start with the width, which is approximately a month and a half from early September to the beginning of October.
Go back in the chart and you will find the low point at $220, almost precisely. Using the Eights scale I go from high of the range to the low. This allows us to stay in through some pull backs but ultimately was stopped out for a small gain of 3%.
Using our Eights scale extension we find our target at $16. In this example, the chart ran in to another consolidation pattern later in January, but I think we can all agree that making a 5.8% gain in a half a month is very good. We do not need to make huge moves.
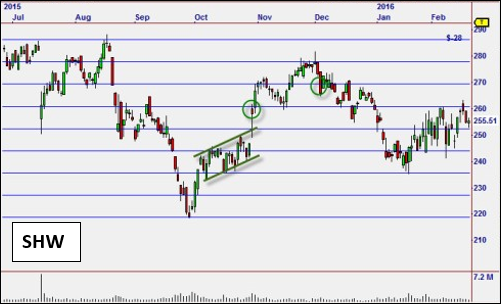
Sherwin-Williams (SHW)
Consolidation: Charles Schwab
In this chart of Charles Schwab (SCHW) we see a nice Broadening Continuation. As we see price break through the lower range of this consolidation pattern we quickly locate the prior high and low for our Eights scale. Price quickly reaches the lower boundaries without closing our position so we once again use the Eights scale extension where we get an exit around $24 for a fast 23% gain.

Charles Schwab (SCHW)
Consolidation: Charles Schwab
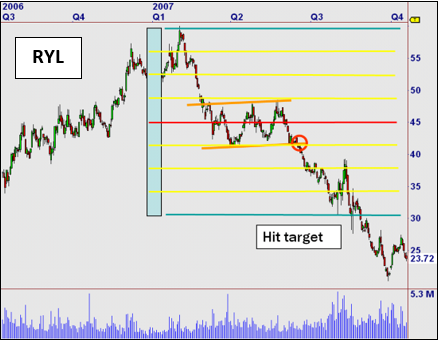
Ryland Group Inc. (RYL)
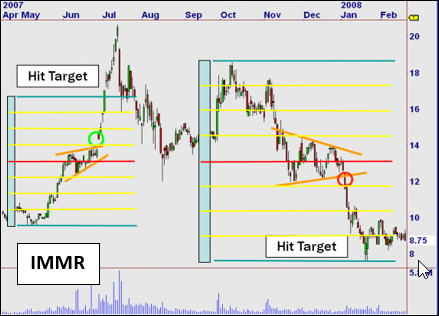
Immersion Corp. (IMMR)
WHAT IS FULGENT.AI?
The team at Fulgent has been applying Artificial Intelligence to the market with great success over the past 20 years. Using specific market measurements, security chart measurement, multiple time frame analysis and cross market correlation, Fulgent AI continually finds the best possible "setups" with unmatched accuracy and profitability - guaranteed to give you an edge, or your money back.

Call Us: 800-880-0338 Email Us: sales@fulgent.ai Fax Us: 512-345-4225
Following over 20 years of experience with A.I. the staff at Fulgent is now focused on ADAPTIVE Machine Learning, where computers learn to trade the markets in the same way human traders do.

Call Us: 800-880-0338
Email Us: sales@fulgent.ai
Fax Us: 512-345-4225
Following over 20 years of experience with A.I. the staff at Fulgent is now focused on ADAPTIVE Machine Learning, where computers learn to trade the markets in the same way human traders do.

