For
For
Profiting from Coral Trend!
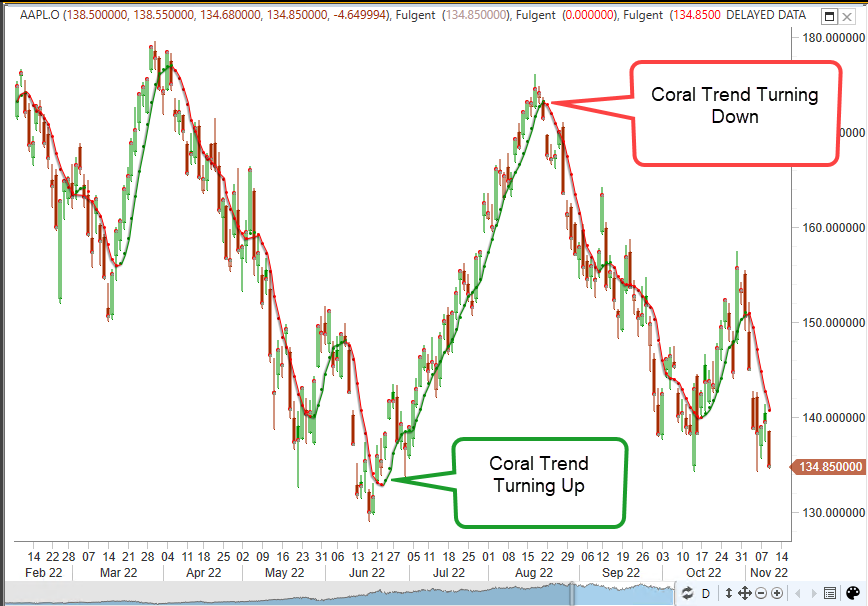
The Coral Trend indicator is one of the best indicators to identify changes in trend, because of its ability to correctly forecast the beginning and end of moves. When trend turns up, the indicator turns from red to green and from green to red when it turns down, as shown here on the left:
As you will discover shortly, we use Coral Trend to generate Coral Trend Pivots – the fastest pivots you can get. These Pivots are then used to generate Signals for the four included Experts.
Profiting from Coral Trend!
The Coral Trend indicator is one of the best indicators to identify changes in trend, because of its ability to correctly forecast the beginning and end of moves. When trend turns up, the indicator turns from red to green and from green to red when it turns down, as shown here above:
As you will discover shortly, we use Coral Trend to generate Coral Trend Pivots – the fastest pivots you can get. These Pivots are then used to generate Signals for the four included Experts.
Getting Faster Signals for Bigger Profits and Smaller Losses
Getting Faster Signals for Bigger Profits and
Smaller Losses
The Secret Ingredient in CT Trader
“Pivots” form at changes in direction in a chart. Once we know a pivot has formed, we can trade in the new direction. The problem is HOW FAST they form.
Historically, we have used Pivots based on Percentage movement (such as Zig Zag) or based on ATRs (Wave Trader). CT Pivot was created to generate faster, more predictive Pivots on which to base Reversal and Breakout trades.
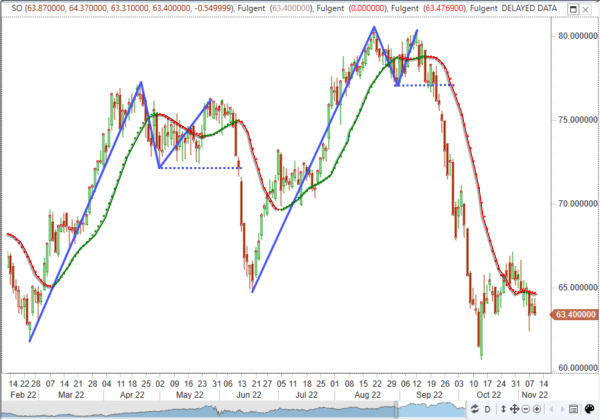
Here is a chart with Zig Zag (pivots) and CT Pivots plotted for comparison.
Coral Trend (CT) Pivots form more quickly AND are better defined, because they follow the ebb and flow of the Coral Trend indicator as described below.
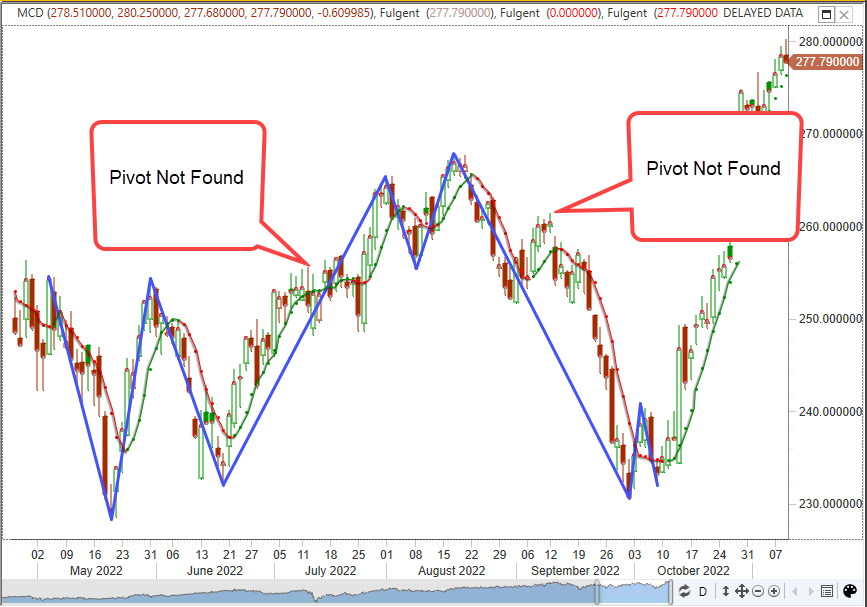
The ZigZag Indicator often misses pivots - and they are late!
CT Pivots form as soon as a turn in Coral Trend is detected.
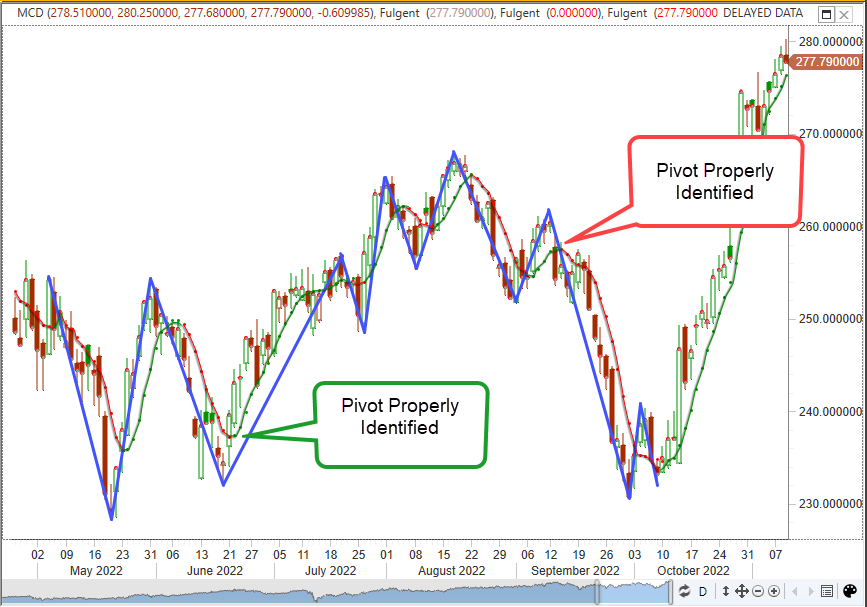
Why CT Pivots are Better:
CT Pivot is based on changes in the CoralTrend indicator. When CoralTrend (for a specific Smoothing Period) turns up or down, the most recent High or Low is identified and drawn as the prior pivot.
Zig Zag pivots are often very late, because the chart has to move the given amount before they can be identified. But Coral Trend Pivots are often found more quickly because they are based on the turn in Coral Trend, not a Percent or ATR move. This makes CT Pivots ideal for any application where pivots are used.
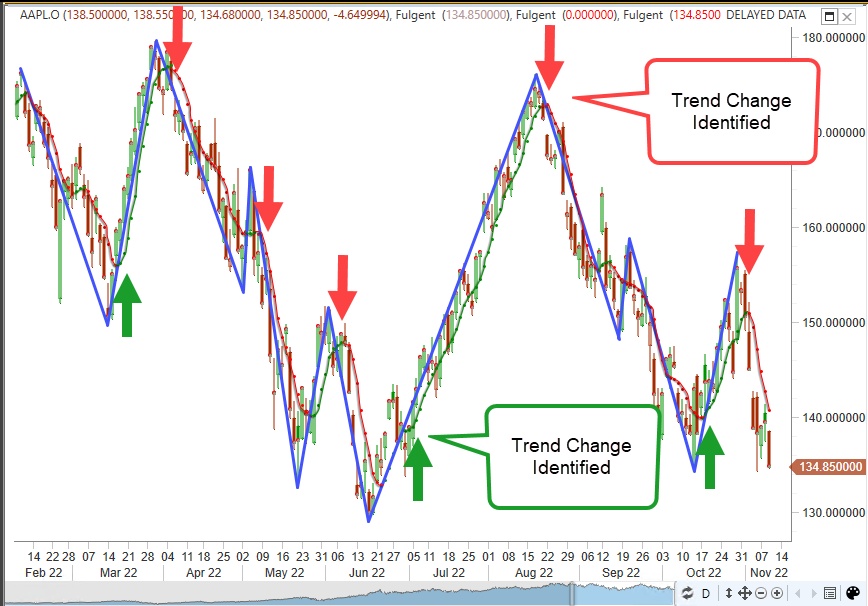
Note: The prior examples show pivots drawn in the charts.
The Experts only show the labels for each System where applicable.
The Secret Ingredient in CT Trader
“Pivots” form at changes in direction in a chart. Once we know a pivot has formed, we can trade in the new direction. The problem is HOW FAST they form.
Historically, we have used Pivots based on Percentage movement (such as Zig Zag) or based on ATRs (Wave Trader). CT Pivot was created to generate faster, more predictive Pivots on which to base Reversal and Breakout trades.
Here is a chart with Zig Zag (pivots) and CT Pivots plotted for comparison.
Coral Trend (CT) Pivots form more quickly AND are better defined, because they follow the ebb and flow of the Coral Trend indicator as described below.
The ZigZag Indicator often misses pivots - and they are late!
CT Pivots form as soon as a turn in Coral Trend is detected.
Why CT Pivots are Better:
CT Pivot is based on changes in the CoralTrend indicator. When CoralTrend (for a specific Smoothing Period) turns up or down, the most recent High or Low is identified and drawn as the prior pivot.
Zig Zag pivots are often very late, because the chart has to move the given amount before they can be identified. But Coral Trend Pivots are often found more quickly because they are based on the turn in Coral Trend, not a Percent or ATR move. This makes CT Pivots ideal for any application where pivots are used.
Note: The prior examples show pivots drawn in the charts.
The Experts only show the labels for each System where applicable.
experts
experts
We Include 4 powerful Experts Based on Coral Trend Pivots
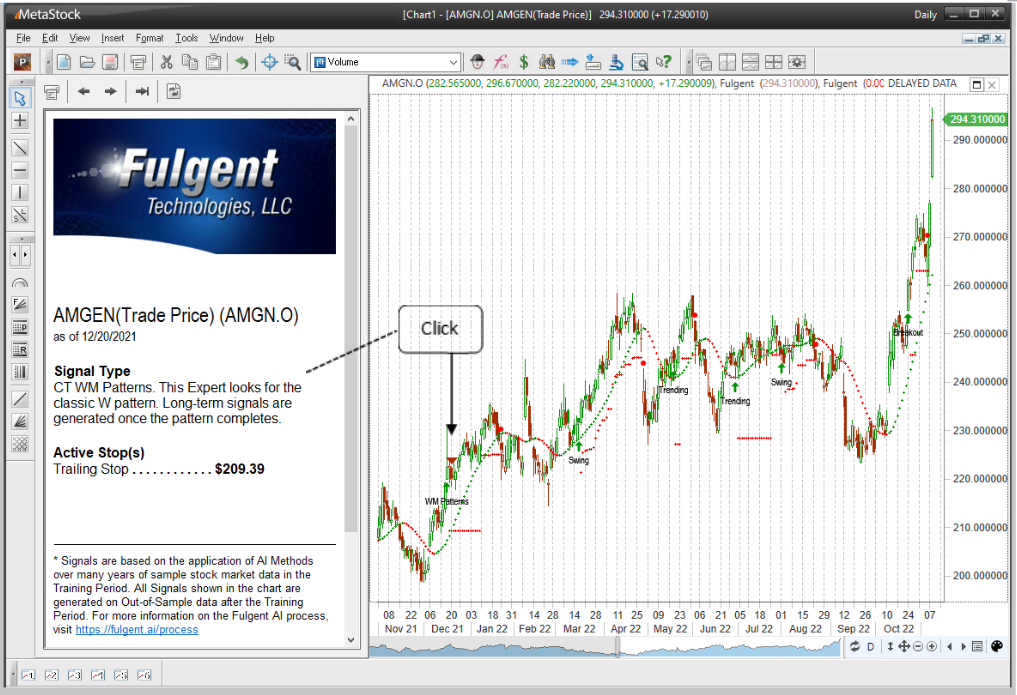
CT Trader Experts in MetaStock 18. Each Expert displays a Signal and Label. It also tracks the Stops that are used with the Expert. Click next to any Signal in the Chart to see a description of the Expert and the Stop Level on that bar.
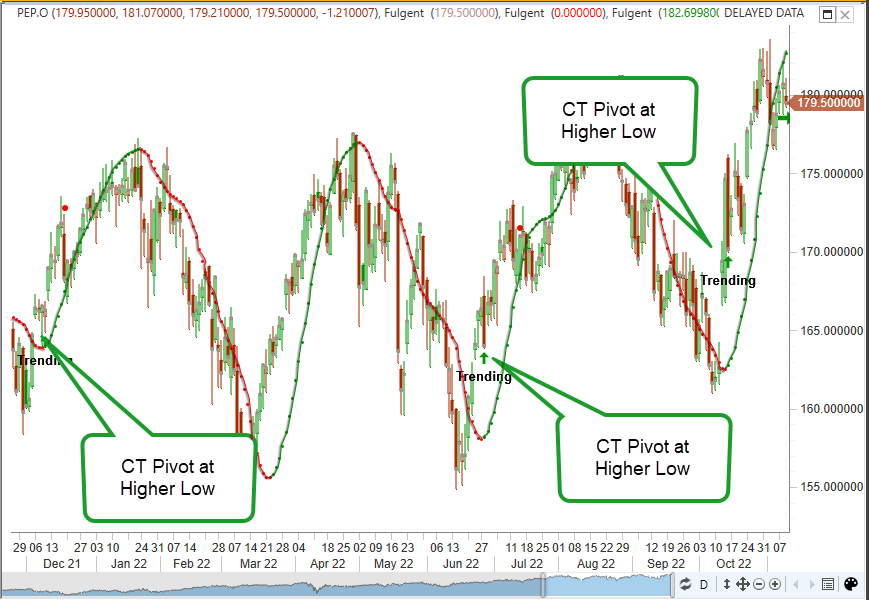
CT Trending
Identifying Pivots that are higher than the previous pivot - the definition of a trending situation.
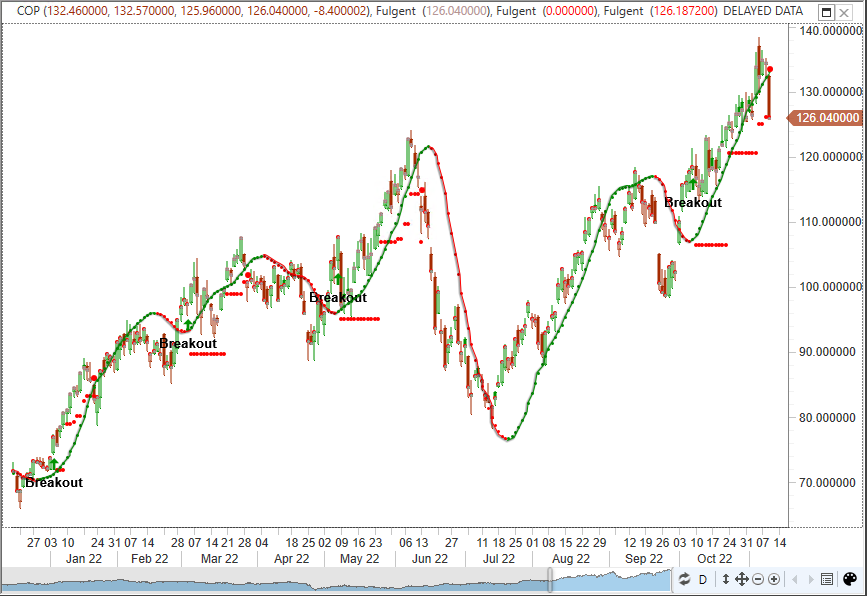
CT Breakout
Uses the prior CT Pivot to
find a breakout. Highly effective!
CT Swing
Identifying and Trading
Short Term Moves!

We Include 4 powerful Experts Based on Coral Trend Pivots
CT Trader Experts in MetaStock 18. Each Expert displays a Signal and Label. It also tracks the Stops that are used with the Expert. Click next to any Signal in the Chart to see a description of the Expert and the Stop Level on that bar.
CT Trending
Identifying Pivots that are higher than the previous pivot - the definition of a trending situation.
CT Breakout
Uses the prior CT Pivot to
find a breakout. Highly effective!
CT Swing
Identifying and Trading
Short Term Moves!
PATTERN EXPERT
PATTERN EXPERT
The Amazing W/M Pattern
The “W” Pattern combines a Support Level with a Breakout through the center of the pattern. When well-formed, this pattern has been proven to be effective in identifying strong moves after a long decline or rally has been observed.
In the case of a “W”, when a high is formed in between support levels to form a “W” shape, a Break of high (center of the “W”) can result in an explosive move. Similarly, the “M” Pattern often identifies falling charts after a long rally into overbought territory.
CT “M” Pattern
Identifying an “M” Pattern Downside Breakout
An “M” Pattern on FAST.
CT “W” Pattern
Identifying a “W” Pattern Upside Breakout
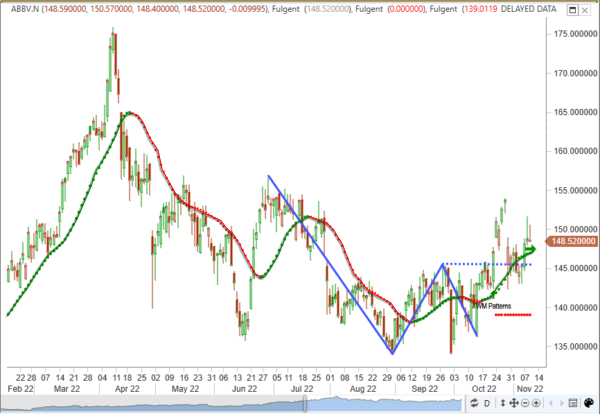
A “W” Pattern on FAST.
The Amazing
W/M Pattern
The “W” Pattern combines a Support Level with a Breakout through the center of the pattern. When well-formed, this pattern has been proven to be effective in identifying strong moves after a long decline or rally has been observed.
In the case of a “W”, when a high is formed in between support levels to form a “W” shape, a Break of high (center of the “W”) can result in an explosive move. Similarly, the “M” Pattern often identifies falling charts after a long rally into overbought territory.
CT “M” Pattern
Identifying an “M” Pattern Downside Breakout
An “M” Pattern on FAST.
CT “W” Pattern
Identifying a “W” Pattern Upside Breakout
A “W” Pattern on FAST.
Let CT Trader Show YOU
the Profitable Moves!
Let CT Trader Show YOU
the Profitable Moves!


Click the blue arrows to see more CT Trader Signals.
From Explosive Breakouts and Trending Signals to Swing Trades to the
WM Pattern, CT Trader is a must-have to find profitable moves in any market.
CT Trader for MetaStock Includes:
The Coral Trend Indicator
Learn to read this powerful Indicator
and profit from trend changes in your charts!
CT Trending Expert
Identifies Important Chart Reversals.
CT WM Pattern Expert
Identifies the WM Patterns.
CT System Tests
Test any or all Expert Systems on your data.
CT Breakout Expert
Identifies Key Breakouts.
CT Swing Expert
Identifies Short Term trading opportunities.
CT Explorations
Bring the Candidates to You Each Day! Search for CT System Signals using any list in MetaStock – or the Entire Market.
Click arrows to see more CT Trader Signals.
From Explosive Breakouts and Trending Signals to Swing Trades to the WM Pattern, CT Trader is a must-have to find profitable moves in any market.
CT Trader for MetaStock Includes:
The Coral Trend Indicator
Learn to read this powerful Indicator
and profit from trend changes in your charts!
CT Trending Expert
Identifies Important Chart Reversals.
CT WM Pattern Expert
Identifies the WM Patterns.
CT System Tests
Test any or all Expert Systems on your data.
CT Breakout Expert
Identifies Key Breakouts.
CT Swing Expert
Identifies Short Term trading opportunities.
CT Explorations
Bring the Candidates to You Each Day! Search for CT System Signals using any list in MetaStock – or the Entire Market.
Pricing & Special Offer
Pricing & Special Offer
Package Summary:
• Coral Trend Indicator
• 4 Great CT Signal Experts
• Explorations that Bring the Candidates to You Each Day
• System Tester
........................... $495
Intro Offer: Just $395
Save $100!
Package Summary:
• Coral Trend Indicator
• 4 Great CT Signal Experts
• Explorations that Bring the Candidates to You Each Day
• System Tester
$495
Intro Offer:
Just $395

Save $100!
Our software is backed by our unconditional Money Back Guarantee. If for any reason you are not fully satisfied, you may return the software, within 30 days of purchase, for a 100% refund, less shipping and handling. Texas residents add 8.25% sales tax. Educational material is non-refundable.
Important Information: Futures, options and securities trading has risk of loss and may not be suitable for all persons. No Strategy can guarantee profits or freedom from loss. Past results are not necessarily indicative of future results. These results are based on simulated or hypothetical performance results that have certain inherent limitations. Unlike an actual performance record, simulated results do not represent actual trading. There are numerous market factors, including liquidity, which cannot be fully accounted for in the preparation of hypothetical performance results all of which can adversely affect actual trading results. No representation is being made that any account will or is likely to achieve profits or losses similar to these being shown.